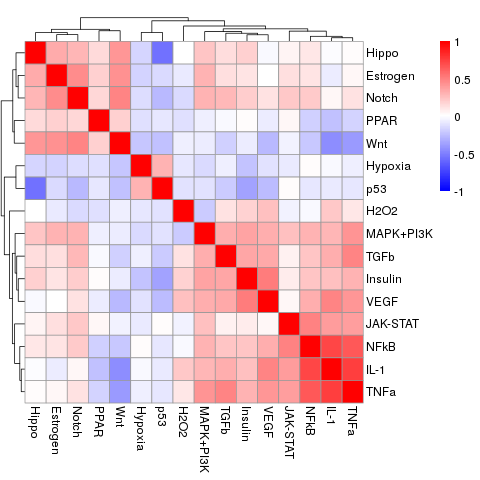
About SPEED2: Signalling Pathway Enrichment using Expression
Data set version 2
SPEED2 is a follow up of our previous web service SPEED
(https://speed.sys-bio.net/). This
new version
contains 16 instead of 11 pathways, and is based on three
times more experimental data sets. It also uses different
statistical methods to derive and score signatures.
How are SPEED2 gene signatures derived?
In short,
for each pathway we identify perturbation experiments in
the GEO microarray database and calculate rescaled
z-scores of differential expression for each gene across
all corresponding experiments (N), and an associated
p-value, using the average of N uniformly distributed
variables on [-1,1] as null model, the so-called Bates
distribution. We compute corresponding false discovery
rates (FDRs) and q-values
of the obtained p-values by randomly shuffling the
rescaled z-values of each experiment before averaging
z-values across experiments (1000 times). Details and the
signature can be found on the "Gene Signatures" page.
How are SPEED2 gene signatures scored?
By default, SPEED considers all genes with expression
values in the SPEED database as the background.
Optionally,
a user can provide a gene list in a text file as the
background set (in the same format as above). There should
be no comments or headers in the file.
These gene lists are
then scored using the ranks for each pathway, using two
different methods to score enrichment:
Bates statistics: Scores if the average rank
deviates from zero. This score is suitable if the provided
gene list contains genes that are either up regulated or
down regulated. As a result, the average score is shown,
and the bars are colored according to the significance
(FDR adjusted p-value using the Bates distribution).
Chi2 statistics: Scores if the rank variance deviate
significantly from a uniform distribution. This score is suitable if the provided
gene list contains genes that are both up and down
regulated. As a result, the increase in the mean squared
ranks compared to a random gene set is shown
and the bars are colored according to the significance
(FDR-adjusted p-value using the Chi2 distribution).
Download raw data and source code
To perform any custom analysis you can use the R-package
speed2, which is available at
https://github.com/molsysbio/speed2. To
install it, load it and get instruction use the following
commands in R:
library(devtools)

install_github("molsysbio/speed2")

library(speed2)

vignette("speed2")
You can download the
processed
or
raw SPEED 2 data that was used to derive the signatures.
A list of experiments that was used to derive SPEED 2
signatures is available here:
list of experiments and
the signatures are available here as tab-delimited files:
SPEED2
signatures. The scripts to reproduce the figures of
the SPEED2 paper can be found here:
create_figures.tgz
Contact information
Nils Blüthgen
How to cite
If you use SPEED2 for your own research, please cite the following article:
Mattias Rydenfelt, Bertram Klinger, Martina Klünemann, Nils Blüthgen, SPEED2: inferring upstream pathway activity from differential gene expression, Nucleic Acids Research (2020), gkaa236
Link
Changelog
- Date X: Original publication
